Remote Sensing of Hydrocarbon Microseepage
Remote sensing can help professionals in the oil and gas industry discover new areas for exploration. One such application is identifying areas of hydrocarbon microseepage.
Microseeps are invisible traces of light hydrocarbons (primarily C1 – C5 substances) that seep to the surface from an oil or gas reservoir. When hydrocarbons migrate upward and reach exposed air at the surface, several manifestations occur at or near the surface that we can monitor with remote sensing. While remote sensing cannot directly detect microseeps, it can reveal alteration patterns at a large scale that provide a starting point for further exploration.
This article provides a quick introduction and some examples of exploring areas of potential microseepage with Landsat and ASTER imagery.
Background
As light hydrocarbon gases move toward the surface and come in contact with the atmosphere, they are oxidized away through a process called bacterial oxidation. This increases the acidity (pH) of the near-surface soils. Soil samples are often needed to confirm these changes to the soil geochemistry, but we can also look for large-scale manifestations through remote sensing. Here are some common indicators of hydrocarbon-induced alteration (Schumacher, 1996; Yang, Van der Meer, and Zhang, 2000):
- Bleaching of red beds: Sandstone formations normally have a reddish color if they contain iron oxide (hematite). When hydrocarbons migrate upward, they dissolve the iron oxide and bleach the sandstone. These areas will show reduced amounts of ferric iron with an increase in elements like pyrite and siderite.
- Clay mineral alteration: Clays such as illite and smectite often convert to kaolinite in areas of microseepage. Sandstone that is rich in kaolinite shows brighter values in a clay ratio image (for example, Landsat TM bands 5/7).
- Increased carbonates: This is a by-product of hydrocarbon oxidation.
- Stressed vegetation: Vegetation in acidic soils takes in different transition elements through the roots. The vegetation will often show abnormal spectral signatures as a result of the changes in soil geochemistry.
To fully analyze areas of potential microseepage, we need more than remote sensing imagery. Field studies are required as well as a thorough knowledge of the underlying geology and fault structures. This article focuses on the remote sensing aspect, specifically alteration patterns.
Let’s look at Kern County, California as an example. The Midway Valley west of Bakersfield contains several massive oil and gas fields. One of these is the Midway-Sunset oil field, which produced 29.3 million barrels of oil in 2014, making it the third largest oil-producing field in the U.S. The Elk Hills field is the largest gas-producing field in California, yielding 80.8 billion cubic feet in 2014.

A view of the McKittrick and Elk Hills fields, looking north. Image courtesy of Google.
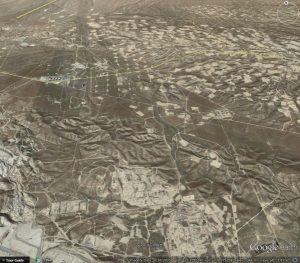
Study area showing locations of major oil/gas fields. Images courtesy of Google.
While this region already has been heavily explored, we can still use it to understand how a hydrocarbon-rich area looks in imagery.
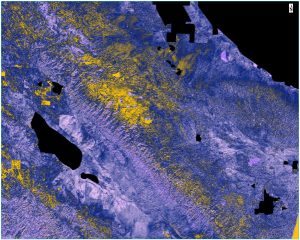
ASTER band ratio image created in ENVI 5.5 that highlights alteration zones, alunite, kaolinite, and pyrophyllite; while suppressing areas of ferric iron. After a “Haze” color table is applied, the alteration zones are shown in yellow. Agricultural fields and bright playas were masked out prior to creating the band ratio so that they did not bias the results.
ASTER is a commonly used sensor for detecting minerals and alteration zones because of its range of bands that cover the visible through SWIR wavelengths. The following image was derived from an ASTER scene in 2007 over the area of interest. Looking for alteration zones is a first step in identifying areas of potential microseepage.
ASTER and Landsat are good for highlighting areas of mineral alteration due to hydrocarbons over large geographic areas; however, they can only provide a starting point for further exploration. WorldView-3, for example, has a finer spatial resolution and a wider range of SWIR bands that can help refine our study of hydrocarbons. Hyperspectral data can also be used to look at areas of vegetation stress using narrowband spectral indices.
ASTER band ratio image created in ENVI 5.5 that highlights alteration zones, alunite, kaolinite, and pyrophyllite; while suppressing areas of ferric iron. After a “Haze” color table is applied, the alteration zones are shown in yellow. Agricultural fields and bright playas were masked out prior to creating the band ratio so that they did not bias the results.
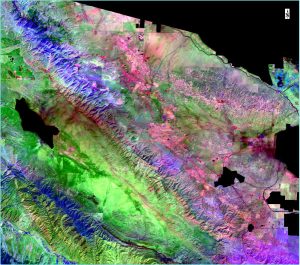
The next image shows a Landsat-8 scene from 2013 (courtesy of the U.S. Geological Survey). A color composite was created that highlights carbonates in a pink color. The carbonates become evident in the valley where the oil and gas fields reside.
ASTER and Landsat are good for highlighting areas of mineral alteration due to hydrocarbons over large geographic areas; however, they can only provide a starting point for further exploration.
WorldView-3, for example, has a finer spatial resolution and a wider range of SWIR bands that can help refine our study of hydrocarbons. Hyperspectral data can also be used to look at areas of vegetation stress using narrowband spectral indices.
References
Schumacher, D. “Hydrocarbon-Induced Alteration of Soils and Sediments.” In Hydrocarbon Migration and its Near-Surface Expression: AAPG Memoir 66, edited by D. Schumacher and M. Abrams (1996).
Yang, H., F. Van der Meer, and J. Zhang. “Aerospace Detection of Hydrocarbon-Induced Alteration.” Geochemical Remote Sensing of the Subsurface, edited by M. Hale. Handbook of Exploration Geochemistry, Vol. 7, Elsevier Science (2000).
California Department of Conservation: Division of Oil, Gas, & Geothermal Resources. 2014 Preliminary Report of California Oil and Gas Production Statistics, Issued July 2015.
The ASTER L1B data product was retrieved from the online EarthExplorer, courtesy of the NASA Land Processes Distributed Active Archive Center (LP DAAC).