Fast and easy integration and classification of hyperspectral optical and thermal data
Optical and thermal hyperspectral data, when used together, allow different varieties of minerals to be mapped.
Considering the main mineralogical groups, the visible (VIS, 0.4–0.7 µm) and near-infrared (NIR, 0.7–1.0 µm) parts of the electromagnetic spectrum allow for mapping surfaces with a high concentration of Fe3+-bearing minerals (e.g., hematite, goethite and jarosite) and shortwave infrared range (SWIR) is useful in detecting carbonates, clay minerals and salts. On the other hand, the VNIR and SWIR spectral ranges are not optimal for detecting the main constituents of igneous rocks, quartz and feldspars. These minerals can be mapped using the thermal region (longwave infrared: LWIR, 8–13 µm).
Clearly, optical and thermal hyperspectral data, when used together, allow different varieties of minerals to be mapped and thus allow lithology mapping in a more complex way. In contrary, considering mineral mapping, the majority of the previous work done for diverse spectral data has mainly focused on single-wavelength-range data. This limits the complexity of the final interpretation.
Recently, a new concept was introduces allowing automatic detection of multiple absorption features and their consequent integration into a mineral classification map. To map automatically multiple absorption features, respectively their parameters, over the different regions of the electromagnetic spectrum, a QUANTools toolbox developed using Interactive Data Language (IDL) was utilized.

Figure 1. Scheme of the processing allowing integration of the absorption feature information detected in VIS/NIR/SWIR and LWIR data and further classification (Kopackova and Koucka 2017).
The above-described approach enabled integration of HyMAP and AHS imaging data (Kopackova and Koucka. 2107). Moreover, the same concept was directly employed to CASI/SASI/TASI hyperspectral datasets and provided results in terms of mineral classification in a quick and easy way (Kopackova et al. 2018).
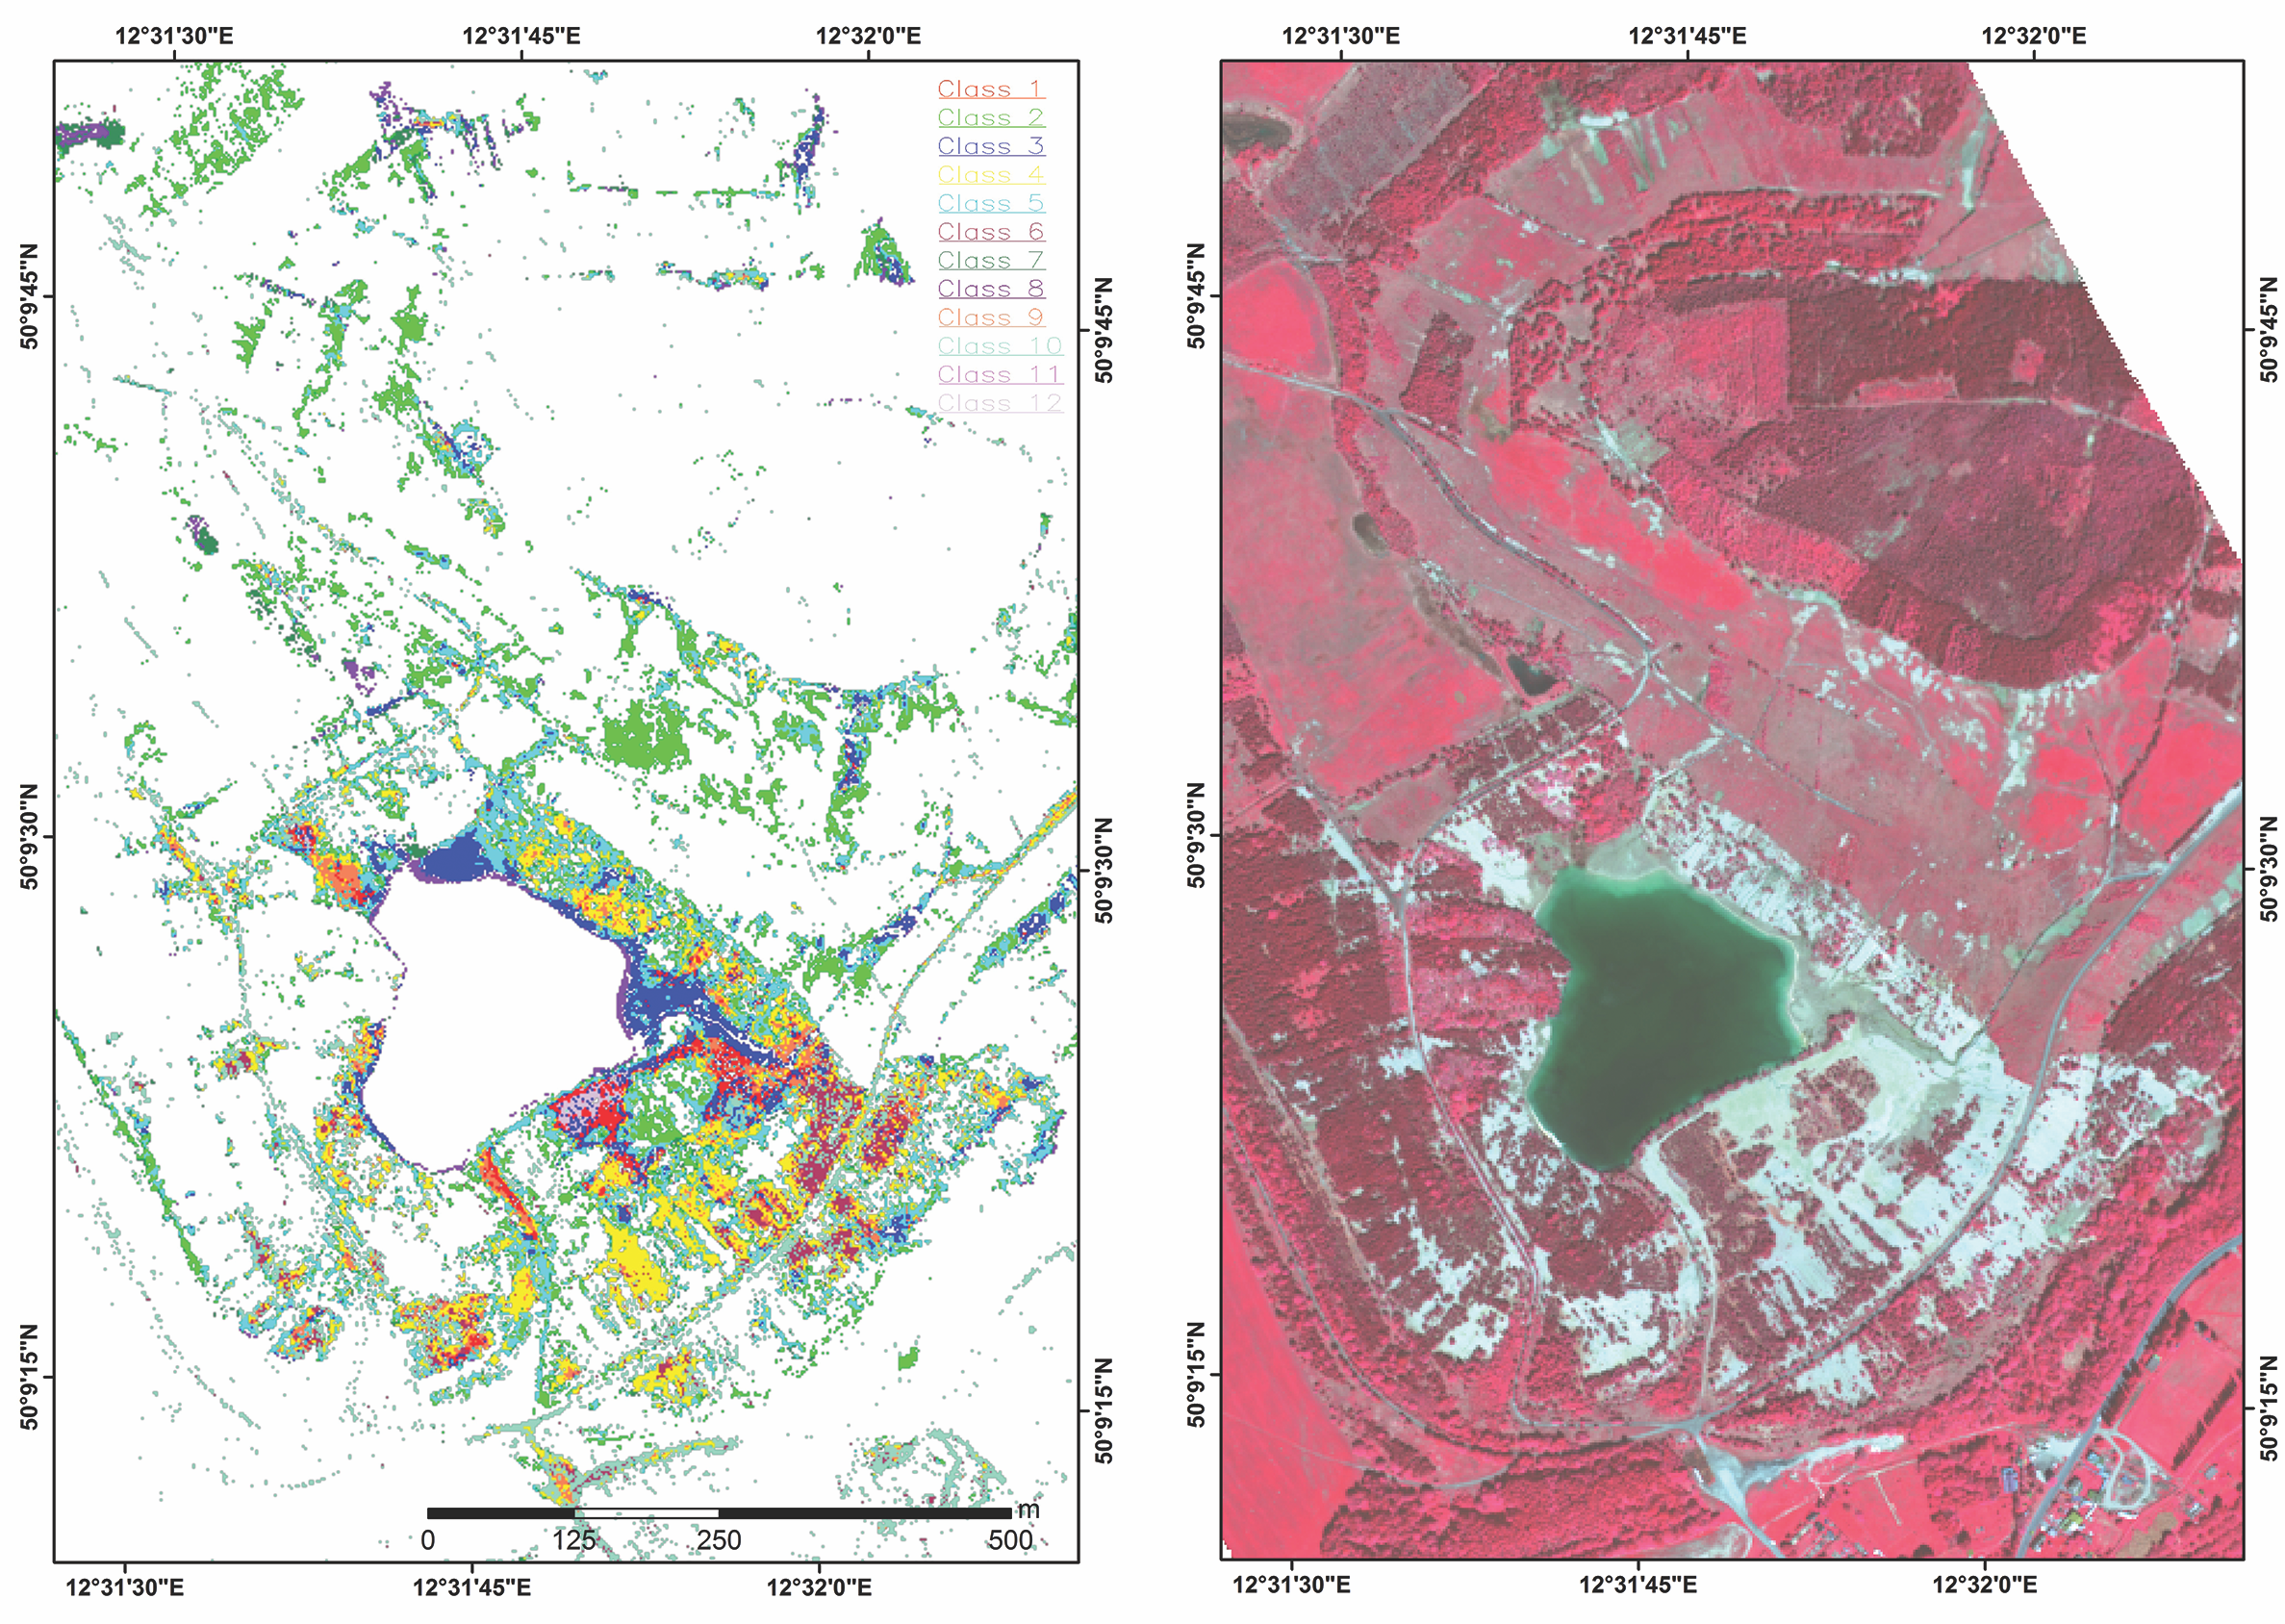
Figure 2. Lítov dump, Czech Republic. Left: mineral mapping using CASI/SASI/TASI data, 12 mineral classes were identified based on the variability among the absorption features present over the VNIR, SWIR and LWIR spectral regions. The class colours correspond with the colours of the average spectrum computed for each class for CASI, SASI and TASI (see below, Figure 3). Dense vegetation and water were masked out prior to mineral mapping. Right: Color-infrared (CIR) band combination dispalyed using CASI dataset.

Figure 3. The average class reflectance of the 12 mineral classes (see Figure 2) derived from CASI and SASI data (continuum removal) and TASI emissivity (continuum removal). The colours and class numbers correspond with classes in Figure 2.
Conclusions
QUANTool toolbox allows automatic multiple-absorption feature parameters extraction from different spectral ranges, and these parameters can be further integrated into one product, which can consequently be successfully used for mineral mapping/classification. The approach described here doesn’t require prior definition of the endmembers, this is a requested routine used for all widely-used spectral mapping techniques (e.g., Spectral angle mapping SAM, Spectral feature fitting SFF and Spectral unmixing). Moreover, there is no need for prior knowledge or data on the specific conditions. This is indeed a big advantage, as a result, it can increase time/cost efficiency as the validation samples can be collected after image classification targeting, specifically the identified surface variability (e.g., mapped classes).
QUANTools have been created using IDL programming language (ENVI/IDL: version 5.0 and higher), the toolbox is available for free; if interested, read more at: http://www.cgs-rs.g6.cz/hyperalgo.html or contact quantoolscgs@gmail.com.
References
Kopačková, V., Koucká, L. Integration of Absorption Feature Information from Visible to Longwave Infrared Spectral Ranges for Mineral Mapping. Remote Sens. 2017, 9, 1006.
Kopačková, V.; Koucká, L., Jelének J., Hanuš J. Fast and easy integration and classification of hyperspectral optical and thermal data: a mineral mapping case study. IGARSS 2018, Valencia, Spain, July 22-27 2018. https://www.igarss2018.org/Papers/viewpapers.asp?papernum=3020
Kruse, F.A. Integrated visible and near-infrared, shortwave infrared, and longwave infrared full-range hyperspectral data analysis for geologic mapping. J. Appl. Remote Sens. 2015, 9, 096005.
McDowell, M.L.; Kruse, F.A. Enhanced Compositional Mapping through Integrated Full-Range Spectral Analysis. Remote Sens. 2016, 8, 757.
Van der Meer, F.D.; van der Werff, H.M.; Van Ruitenbeek, F.J.; Hecker, C.A.; Bakker, W.H.; Noomen, M.F.; van der Meijde, M.; Carranza, E.J.M.; De Smeth, J.B.; Woldai, T. Multi-and hyperspectral geologic remote sensing: A review. Int. J. Appl. Earth Obs. Geoinf. 2012, 14, 112–128.
Van der Meer, F.D.; Kopačková, V.; Koucká, L.; van der Werff, H.M.; van Ruitenbeek, F.J.; Bakker, W.H. Wavelength feature mapping as a proxy to mineral chemistry for investigating geologic systems: An example from the Rodalquilar epithermal system. Int. J. Appl. Earth Obs. Geoinf. 2017.